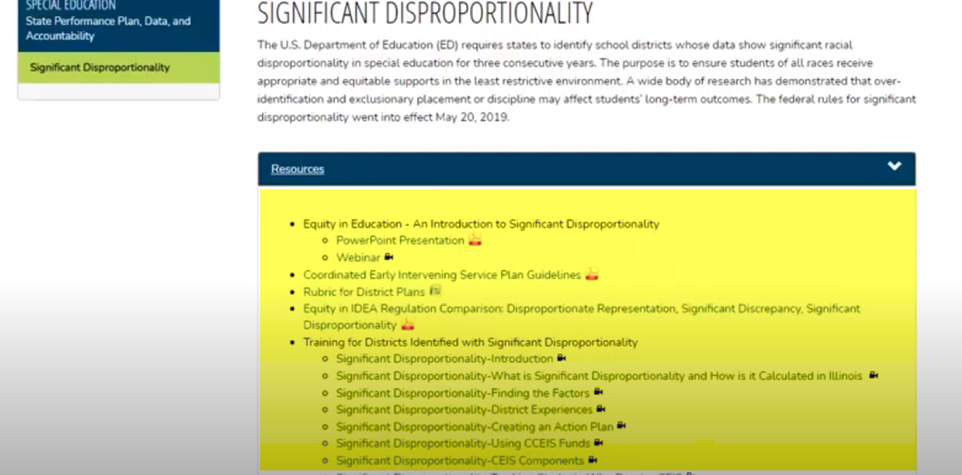
Significant Disproportionality
The U.S. Department of Education (ED) requires states to identify school districts whose data show significant racial disproportionality in special education for three consecutive years. The purpose is to ensure students of all races receive appropriate and equitable supports in the least restrictive environment. A wide body of research has demonstrated that over-identification and exclusionary placement or discipline may affect students’ long-term outcomes. The federal rules for significant disproportionality went into effect May 20, 2019.
For instructions on how to utilize the Significant Disproportionality Report in I-Star, see the instructions below.
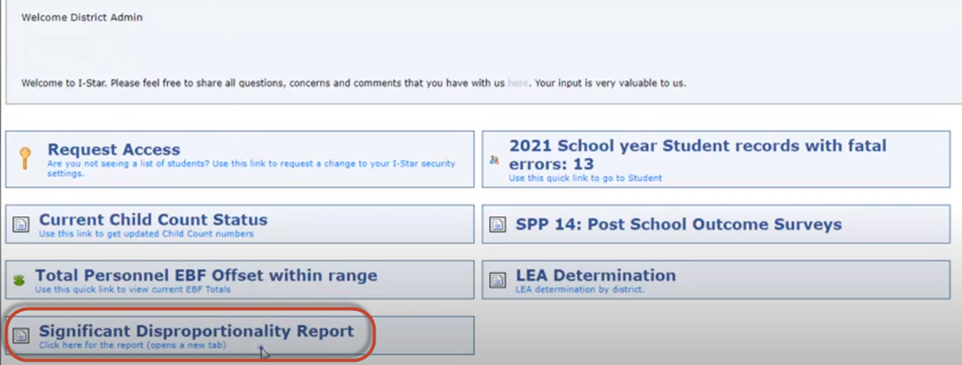
Click the Significant Disproportionality Report button.
Your district's report will open in a new tab.
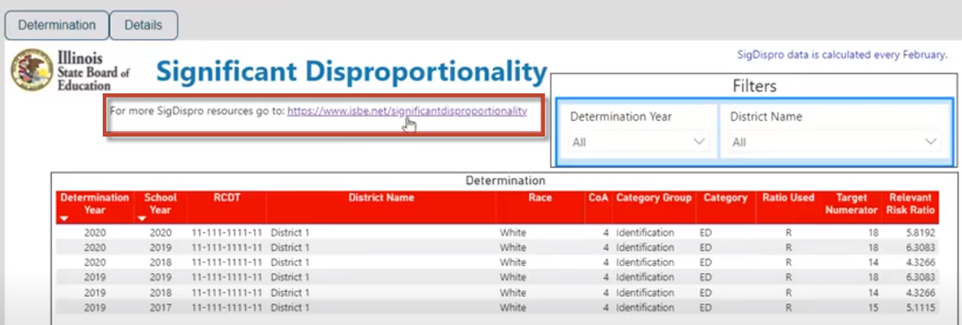
If your district has determinations, they will appear on this opening screen.
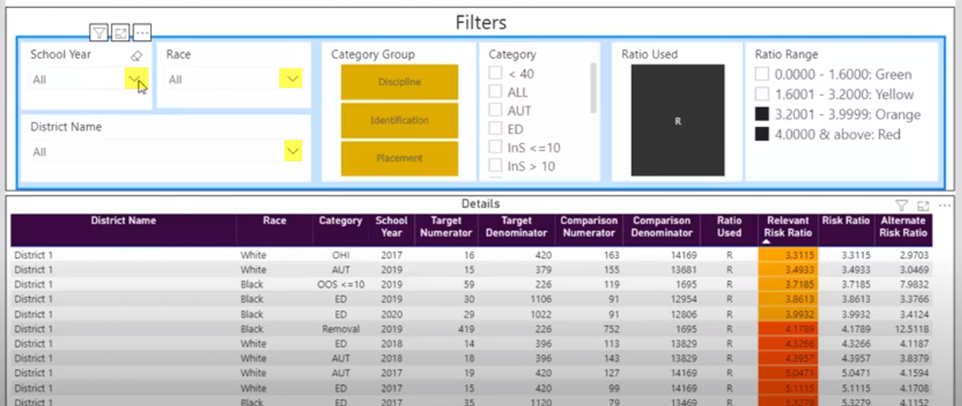
You can change the Determination Year by clicking the drop-down arrow or if you are a coop with multiple districts, you can also use the drop-down arrow to filter out specific District Names.
You can clear your filters at any time by clicking the eraser icon.
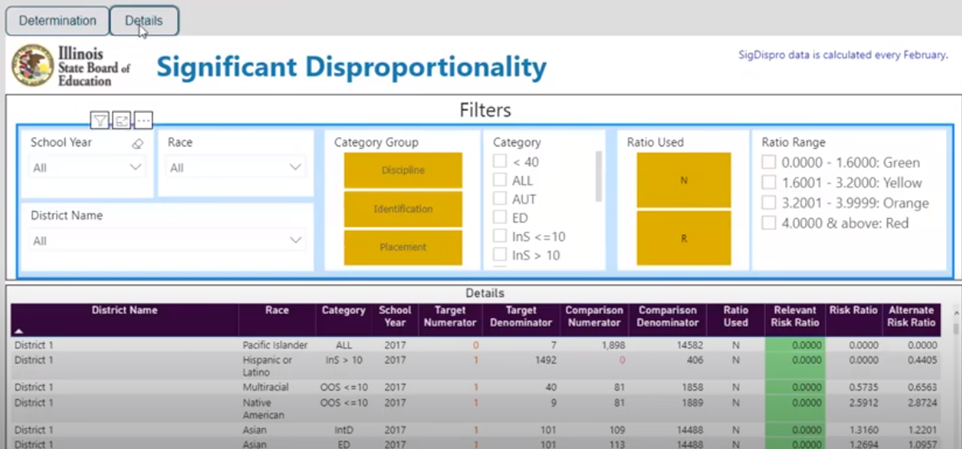
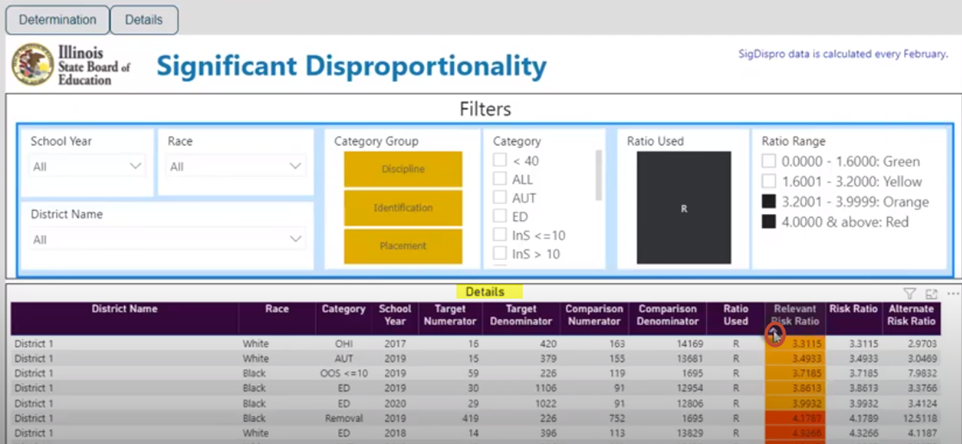
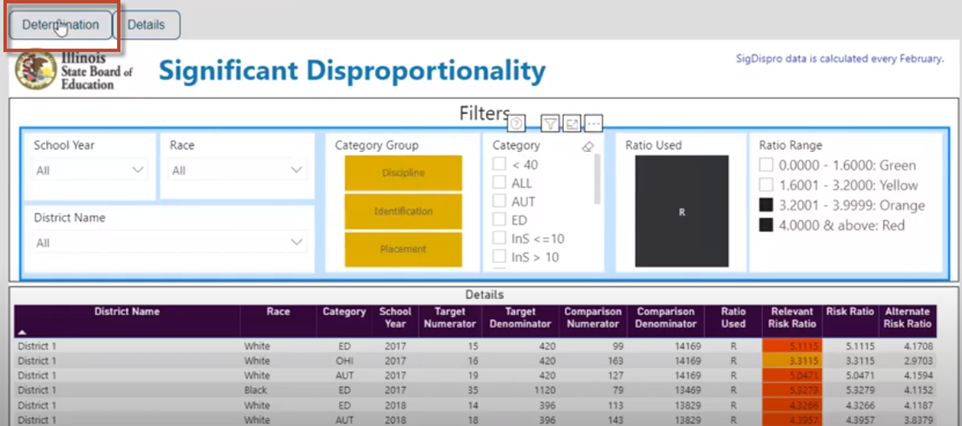
To view a more in-depth report, click the Details button at the top of the page.
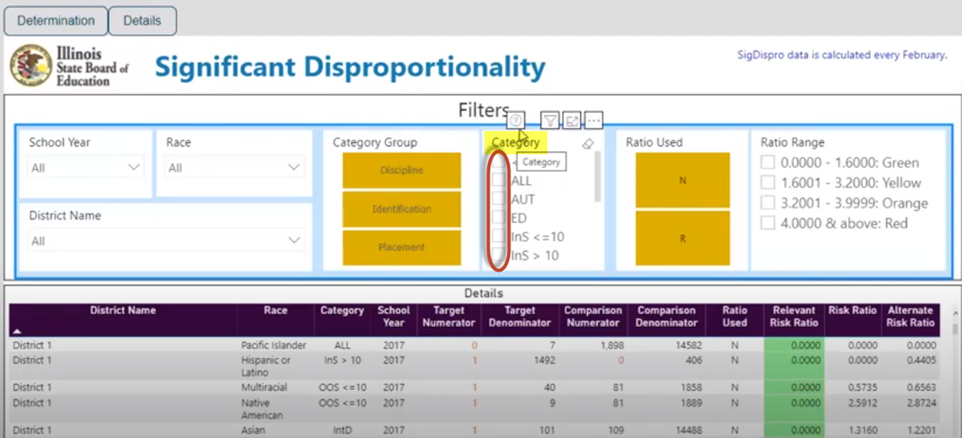
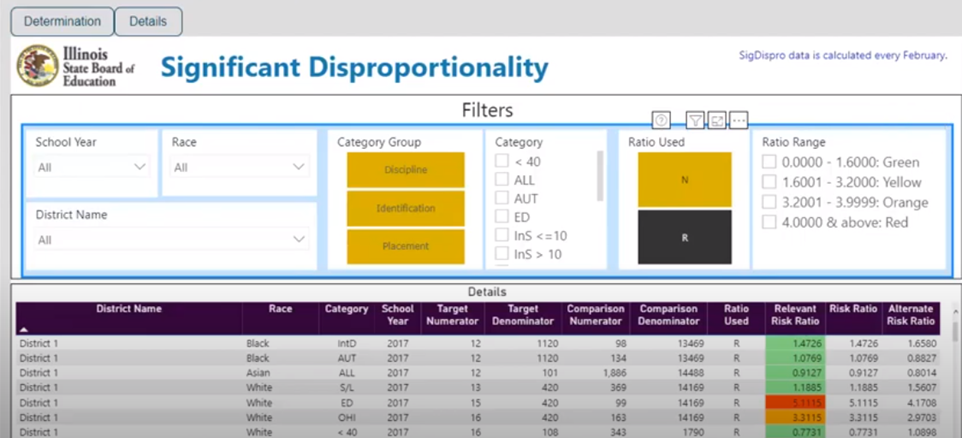
As you can see, there are several more filter options in this section.
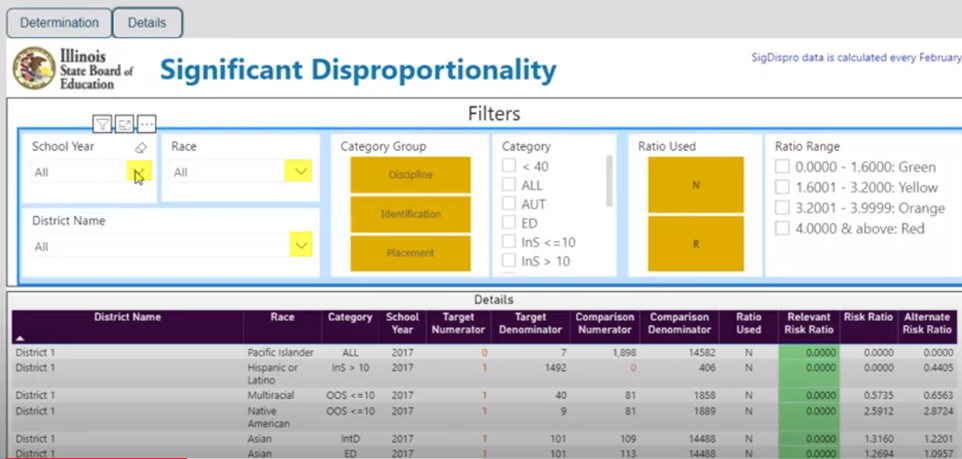
Use the drop-down arrows to filter School Year, Race, and District Name.
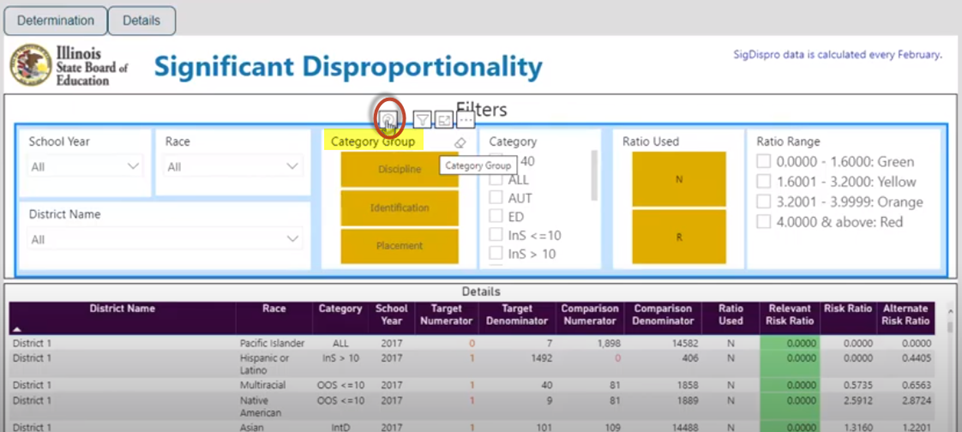
You are able to filter through Category Group of Discipline, Identification, or Placement.
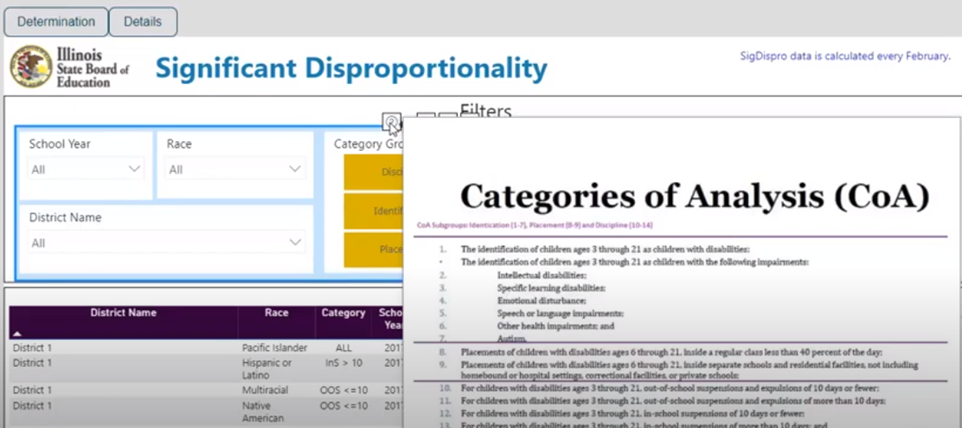
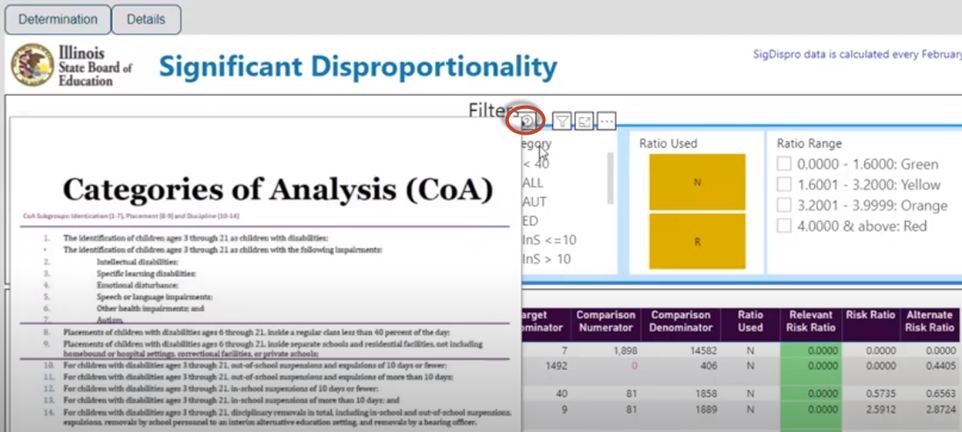
Hover over the question mark to find an explanation of the Categories of Analysis.
Click the Category you wish for the data to display below.
You can use control + click to choose more than one Category Group.
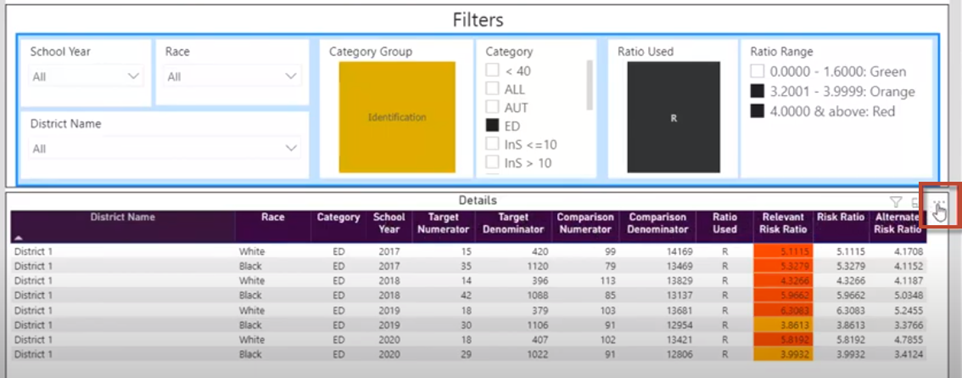
Use the check boxes in the Category section to change the Category of Analysis displayed below.
Once again, you can click on the question mark to show the Categories of Analysis.
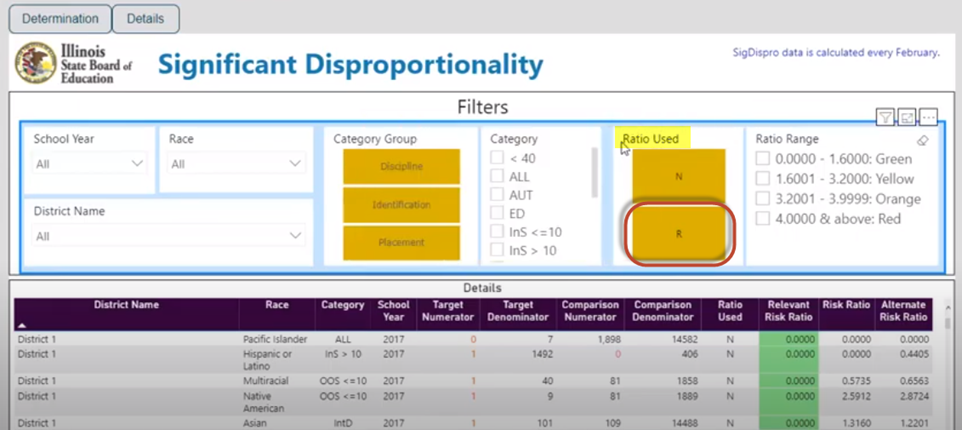
One of the first things you will want to do is to filter out anything with an N under Ratio Used.
N is No Ratio Used. This means it is not taken into consideration for Significant Disproportionality.
They didn't have a minimum number of 10 students in the target numerator, or cell size, or a minimum number of 30 students in the target denominator, N-size, for a calculation to be performed on this particular Category of Analysis for this particular race.
To filter out N, select the R and/or the A if it's available.
Once you filtered out N, you will now see the results for the categories that had enough data to perform a Risk Ratio calculation.
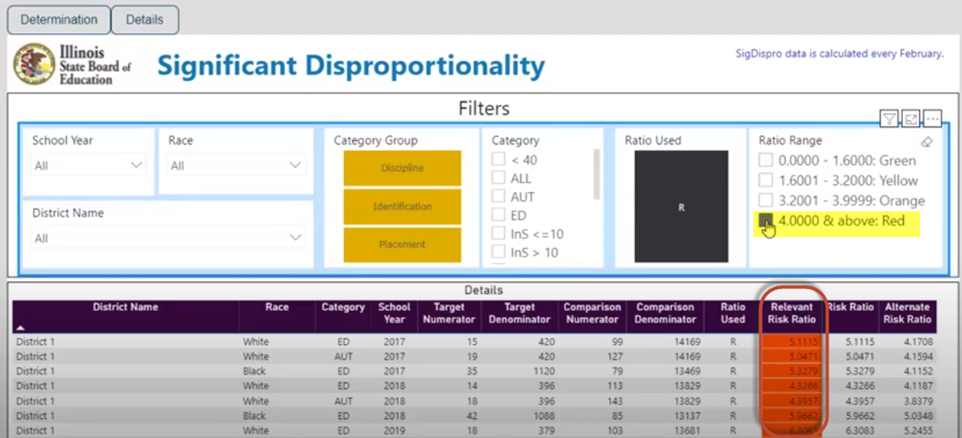
You can then filter even further by the Ratio Range. Any relevant risk ratio that is 4.0000 and above is red, which means that this category/race combination is over the threshold for that school year.
When three consecutive school years for a category/race combination exceeds the threshold, then that is what makes up a determination.
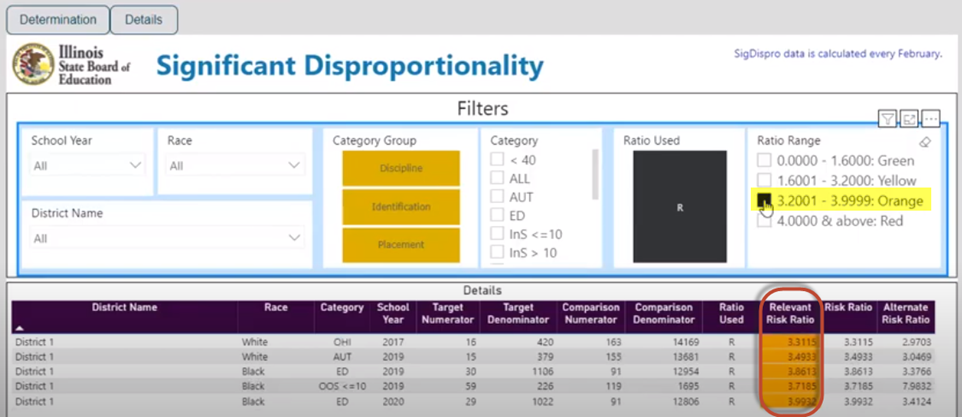
Anything from 3.2001-3.9999 is orange. While these are not over the threshold, these are results of concern as they may need attention in the future to avoid crossing the 4.0000 threshold.
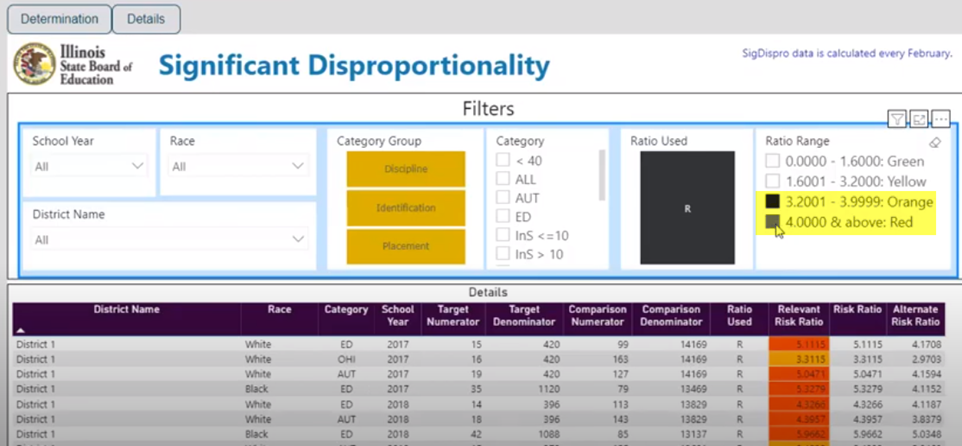
Use the control + click to select multiple ranges at once.
In the Details section, you can sort any of the columns by clicking the arrow in each column.
Once again, you can use the drop-down arrows in the Filter section to filter your results at any time.
To clear a Filter section, click the erase button.
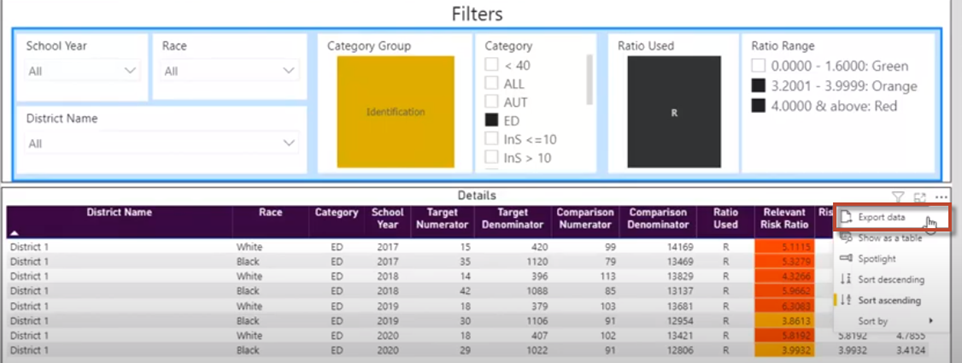
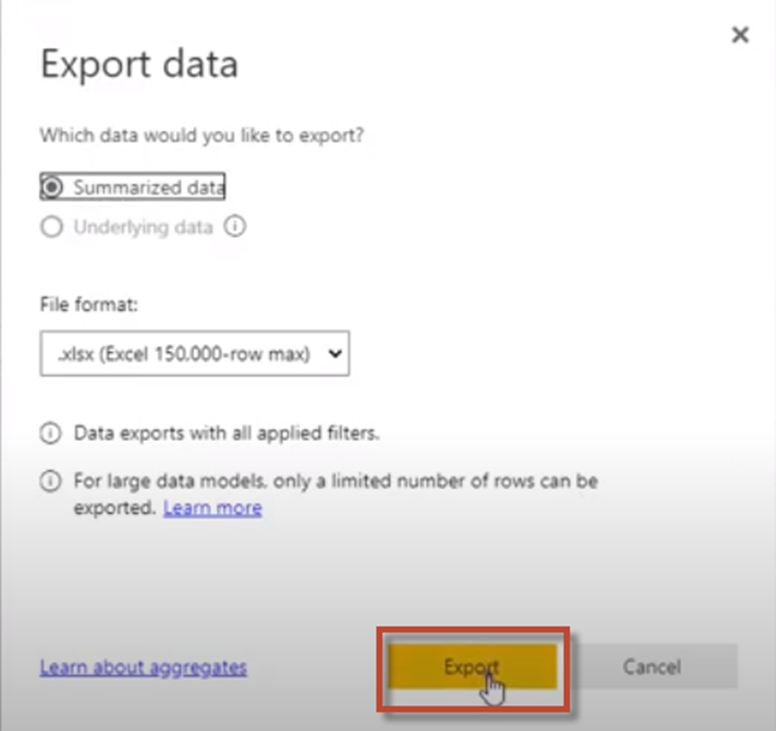
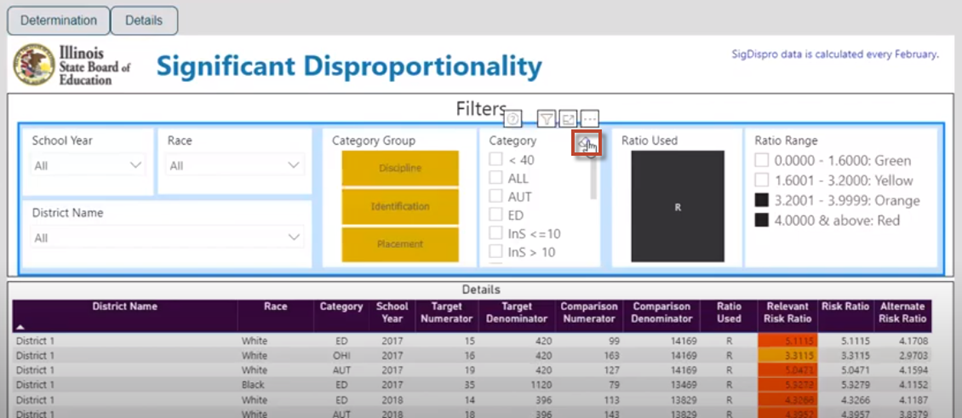
Once you have your desired results in the Details section, you can go to more options and export the data to Excel.
Click on the ellipsis and click Export Data.
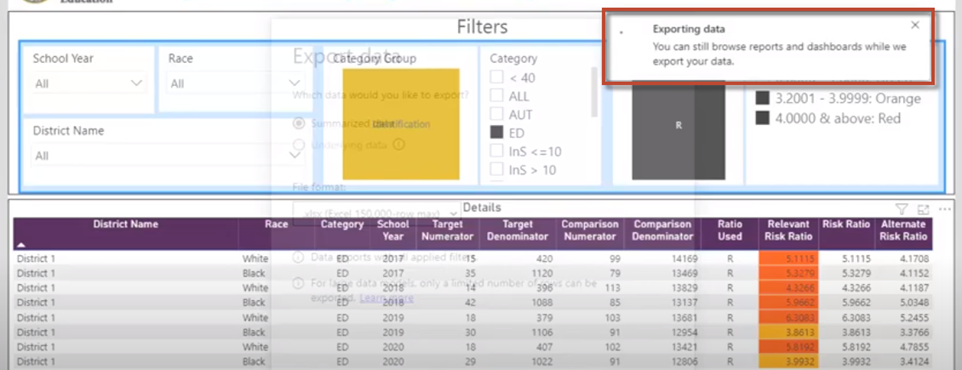
Click Export.
You will see that your data was exported successfully.
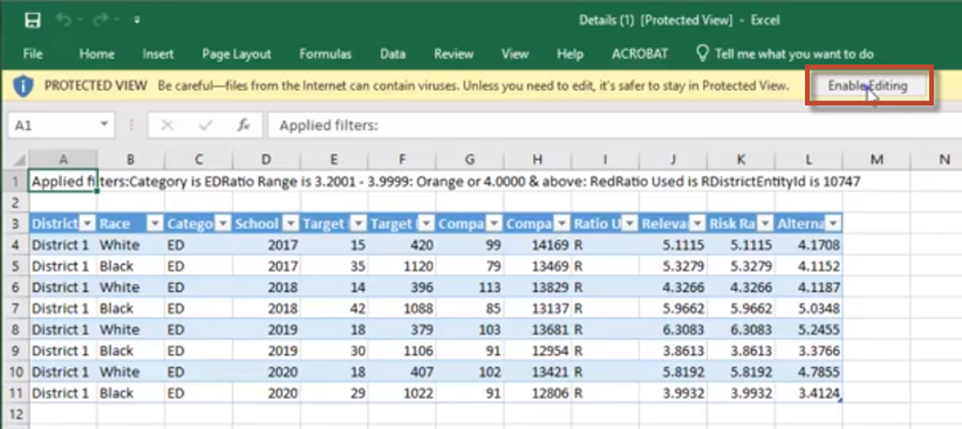
Click on the Excel Download to open the file.
If you would like to further edit or filter your data, click Enable Editing in Excel.
If you are needing to export multiple sets of data, remember to come back and use the eraser button in each filter category to start from scratch.
Let's go back to the main page for a few more resources. Click the Determination button.
For more resources on Significant Disproportionality, click HERE.
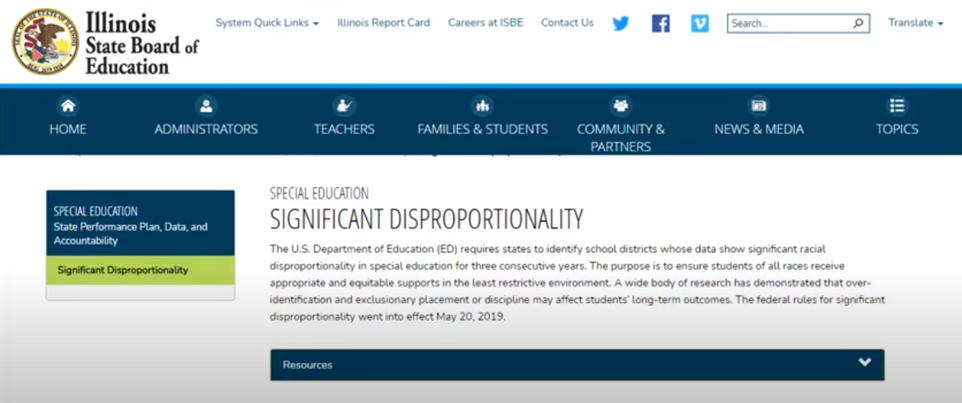
This will bring you to ISBE’s website on Special Education Significant Disproportionality.
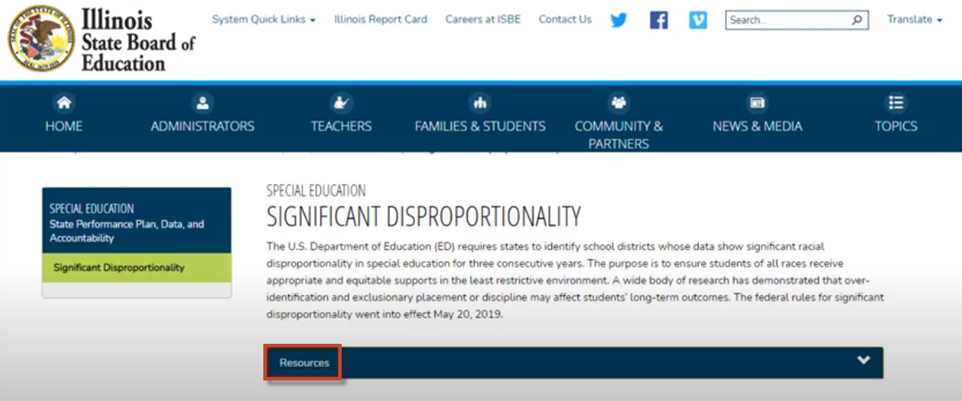
Click Resources.
For technical questions with Significant Disproportionality call Harrisburg Project at 800-635-5274 or email [[1]].
For questions on Determinations call 217-782-5589 or email [[2]] at the Division of Special Education at ISBE.
